Navigating the Business Intelligence Landscape
There are several players in the Business Intelligence market. Gartner identified a few as top players (Microsot PowerBI, Tableau and Qlik) but a lot others as challengers and visionaries or niche players worth mentioning (i.e. Domo, Looker…).
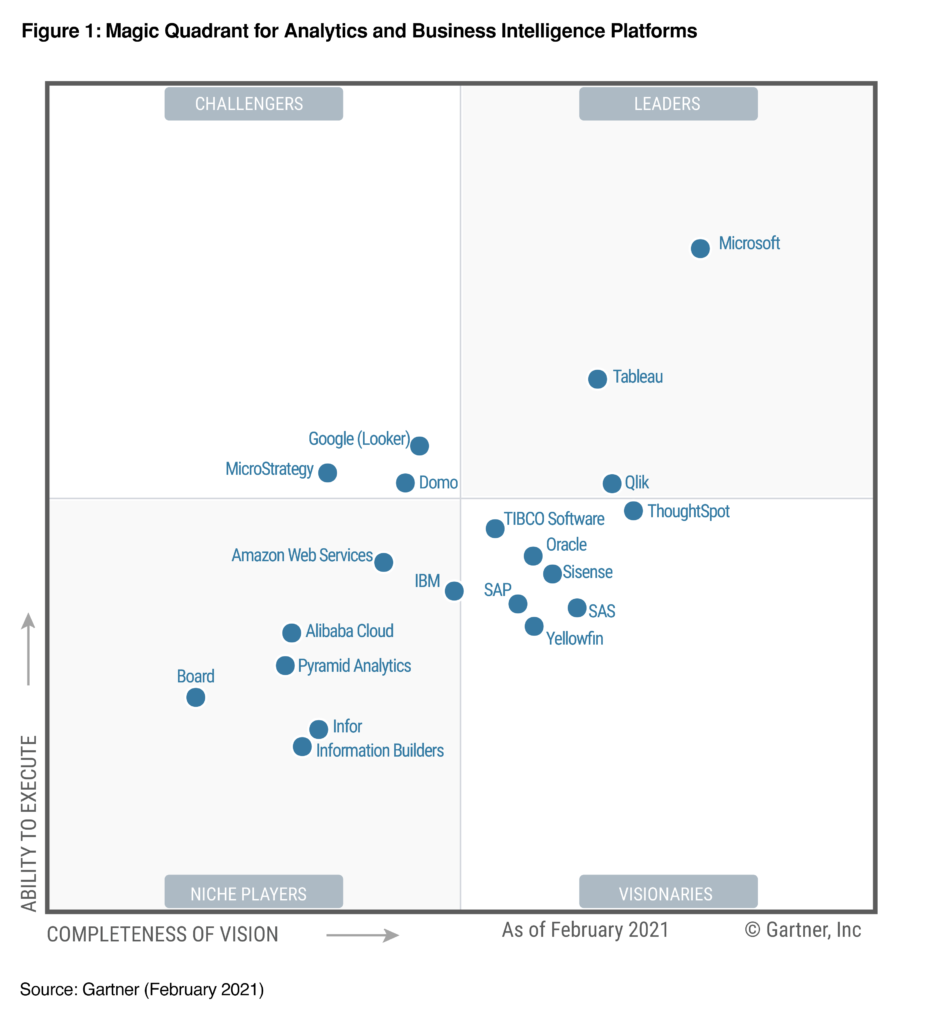
Yet, the above Magic Quadrant for Analytics and Business Intelligence Platforms is not comparing tools with the same capabilities rather tools that share similar capabilities. For instance, Domo is an all-in-one solution that enables users to connect, store, transform and visualise data in a single platform while Tableau or Microsoft PowerBI focus essentially on the data visualisation and often rely on other tools to connect to data sources, store data and prepare it.
As businesses require to do all these things in order to generate insightful reports that can enable them to make critical decisions, it is imperative to compare how the tools from the Business Intelligence market differ across this process.
1. Connecting to Multiple Data Sources:
Domo excels in connecting to a multitude of data sources, both on-premises and in the cloud. Its cloud-based architecture facilitates real-time data integration, enabling users to harness insights from diverse origins effortlessly. On the other hand, Microsoft PowerBI, deeply integrated with the Microsoft ecosystem, effortlessly connects to a wide array of data sources. From Excel spreadsheets to cloud-based databases, PowerBI ensures a seamless flow of data for comprehensive analysis. The other tools often require custom connections to be setup to capture the required data (using APIs on other approaches).
2. Storing Data:
Interestingly, it is not often the purpose of Business Intelligence tools to store data and we see an increasing number of solutions offering capabilities to read data directly from cloud data warehouses (Federated Snowflake views for Domo, Looker using Google Cloud Storage and Power BI leveraging Azure). These approaches, although reducing the total cost of the end-to-end solution, can impact the capabilities of the visualisations as well as user-interface as the performance of the reports is based on the performance of the cloud storage itself.
Yet, it also means that businesses need to budget for the cost of storage for data that will be prepared only for the sole purpose of visualization. On the other hand, solutions that allow for their own storage may allow for more flexibility in reporting (i.e. more levels of aggregations) which can result in better user experience.
3. Preparing Data for Analysis:
Similarly to Storage, some Business Intelligence solutions do not provide very advanced ETL capabilities and even less provide the capabilities to perform data science scripting or modelling inside the tool. Most BI solutions provide capabilities like Microsoft PowerBI‘s Power Query which enables to create calculations and formulas for charts. Going beyond this (aggregations, forecasting, etc.), Domo allows users to cleanse, transform, and enrich data without extensive coding in a drag-and-drop ETL layer where it is also possible to code in SQL, Python or R.
4. Visualizing the Data:
This is where Microsoft Power BI and Tableau really get their ‘leadership’ from the Gartner Magic quadrant. PowerBI offers a rich set of visualization options, from basic charts to sophisticated dashboards. Its integration with other Microsoft tools enhances the visual storytelling capabilities of reports and dashboards. On the other hand, Tableau is renowned for its powerful visualization capabilities. With an extensive library of charts and graphs, users can create visually striking dashboards that effectively communicate insights.
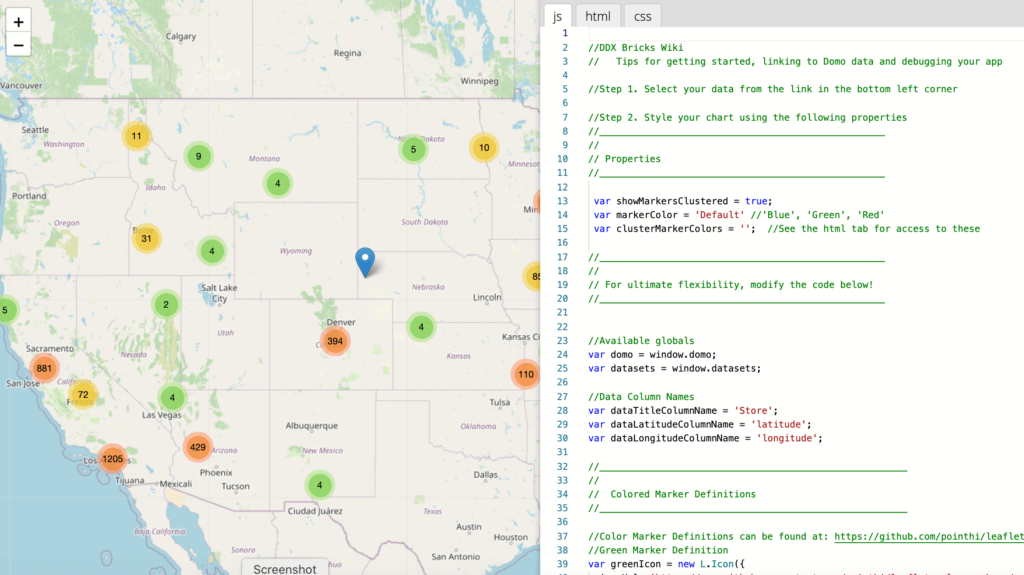
Others like Domo, Looker or Qlik provide interactive dashboards and charts and have lately tried to compete by enabling more flexibility to their users. Domo for instance opening the ability for users to create their own charts from scratch using Domo DDX Bricks.
Conclusion: Empowering Business Intelligence Across the Spectrum
In the competitive Business Intelligence market, it is important for businesses to understand the capabilities of the different tools and clearly define what they need in order to make the right choices.
If you need help in defining requirements for a Business Intelligence project or to review your existing architecture and identify gaps or opportunities, Rising Digits can help you.